Hello Forum,
I’m working with the xwiki for nearly a year now and I’m very happy with it.
But there is one problem, which i wasn’t able to fix.
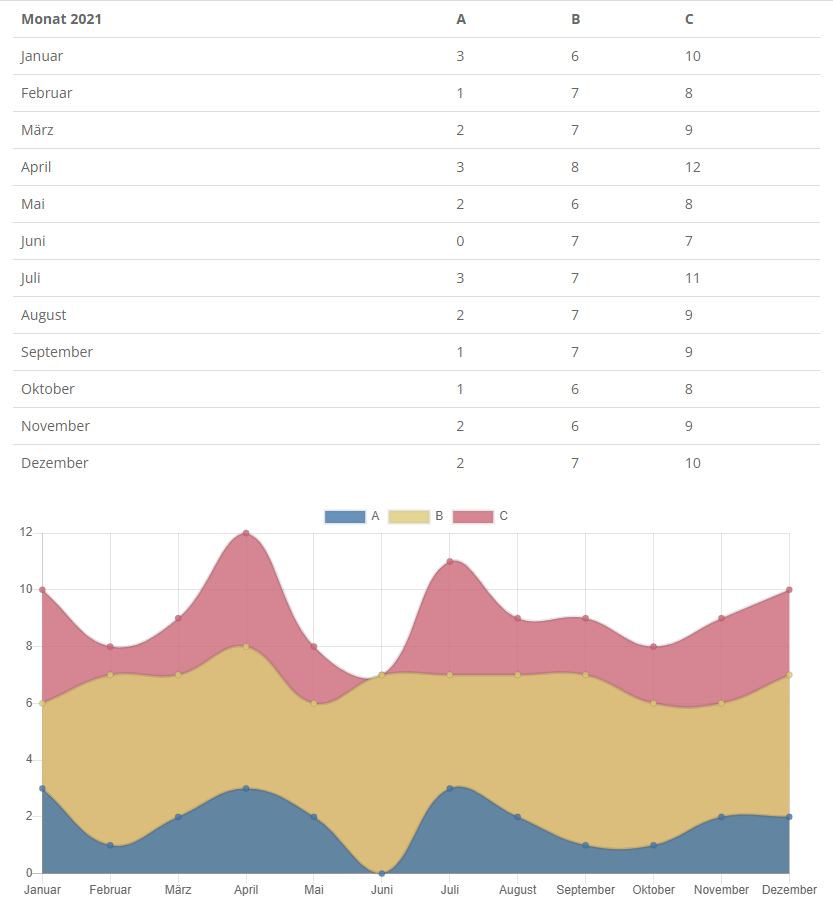
I want to show some charts with the chart.js plugin and it works fine with the bar chart, but for the line chart there is a preference for curving the lines.
I searched this forum and the internet and found that i should insert “tension: 0” or “BerzierCurve: false” to straighten the line. But all the examples work fine direct programming a website, not with the plugin in xwiki.
So I like to ask you, where should I write this in?
Thank you very much in advance!
Christian
Xwiki Debian 14.2.1
Chart.js Integration 1.5
Here is the sourcecode I wrote for my example:
Blockquote
(% id=“multipleDataSetsLine” %)
|=Monat 2021|=A|=B|=C
|Januar|3|6|10
|Februar|1|7|8
|März|2|7|9
|April|3|8|12
|Mai|2|6|8
|Juni|0|7|7
|Juli|3|7|11
|August|2|7|9
|September|1|7|9
|Oktober|1|6|8
|November|2|6|9
|Dezember|2|7|10
{{tableToChartJS type=“line” table=“multipleDataSetsLine” multipleDataSets=“true”/}}
And here is the result: