I cannot set the min/max values for my y-axis. Am I doing something wrong with the options field?
{{chartjs type="line" options="~"scales~":{~"y~":{~"min~":0,~"max~":5~}~}"}}
{
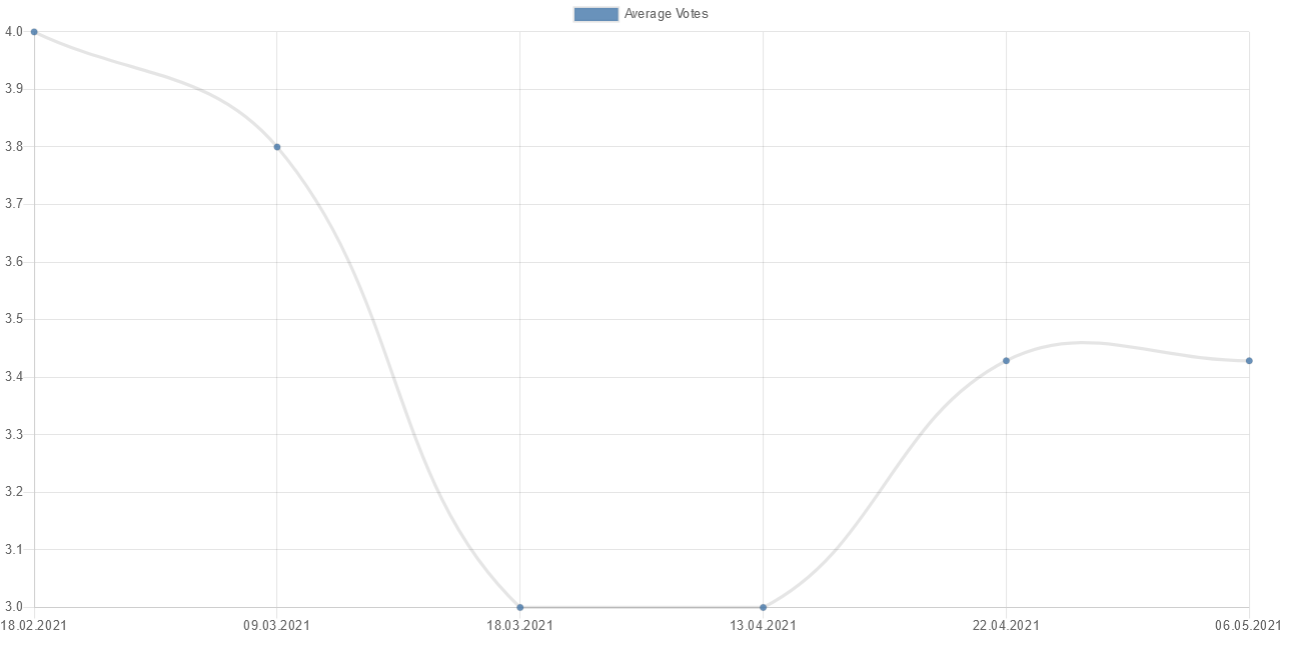
"labels": ["18.02.2021", "09.03.2021", "18.03.2021", "13.04.2021", "22.04.2021", "06.05.2021"],
"datasets": [{
"label": "Average Votes",
"data": [4, 3.8, 3, 3, 3.4286, 3.4286],
"fill": "false"
}]
}
{{/chartjs}}
It renders like this: