I’ve a problem with the chart macro:
For all charts with just years in 1st column "2010, 2011,… the all charts show “2009, 2010,…” on x-axis.
Same is visible above in example "Using “xy_line3D”, where e.g. the value “|2001-4|153.8|117.2” is shown at “March-2001” in the chart.
→ All chart-values are offset by 1 date-unit.
Thanks & BR, Markus
PS: I already posted my questen in wiki, but Vincents asked to post here.
Can you post your input example that you use so that we can try to reproduce? Thx
Sure…I hope I didn’t do a beginners error 
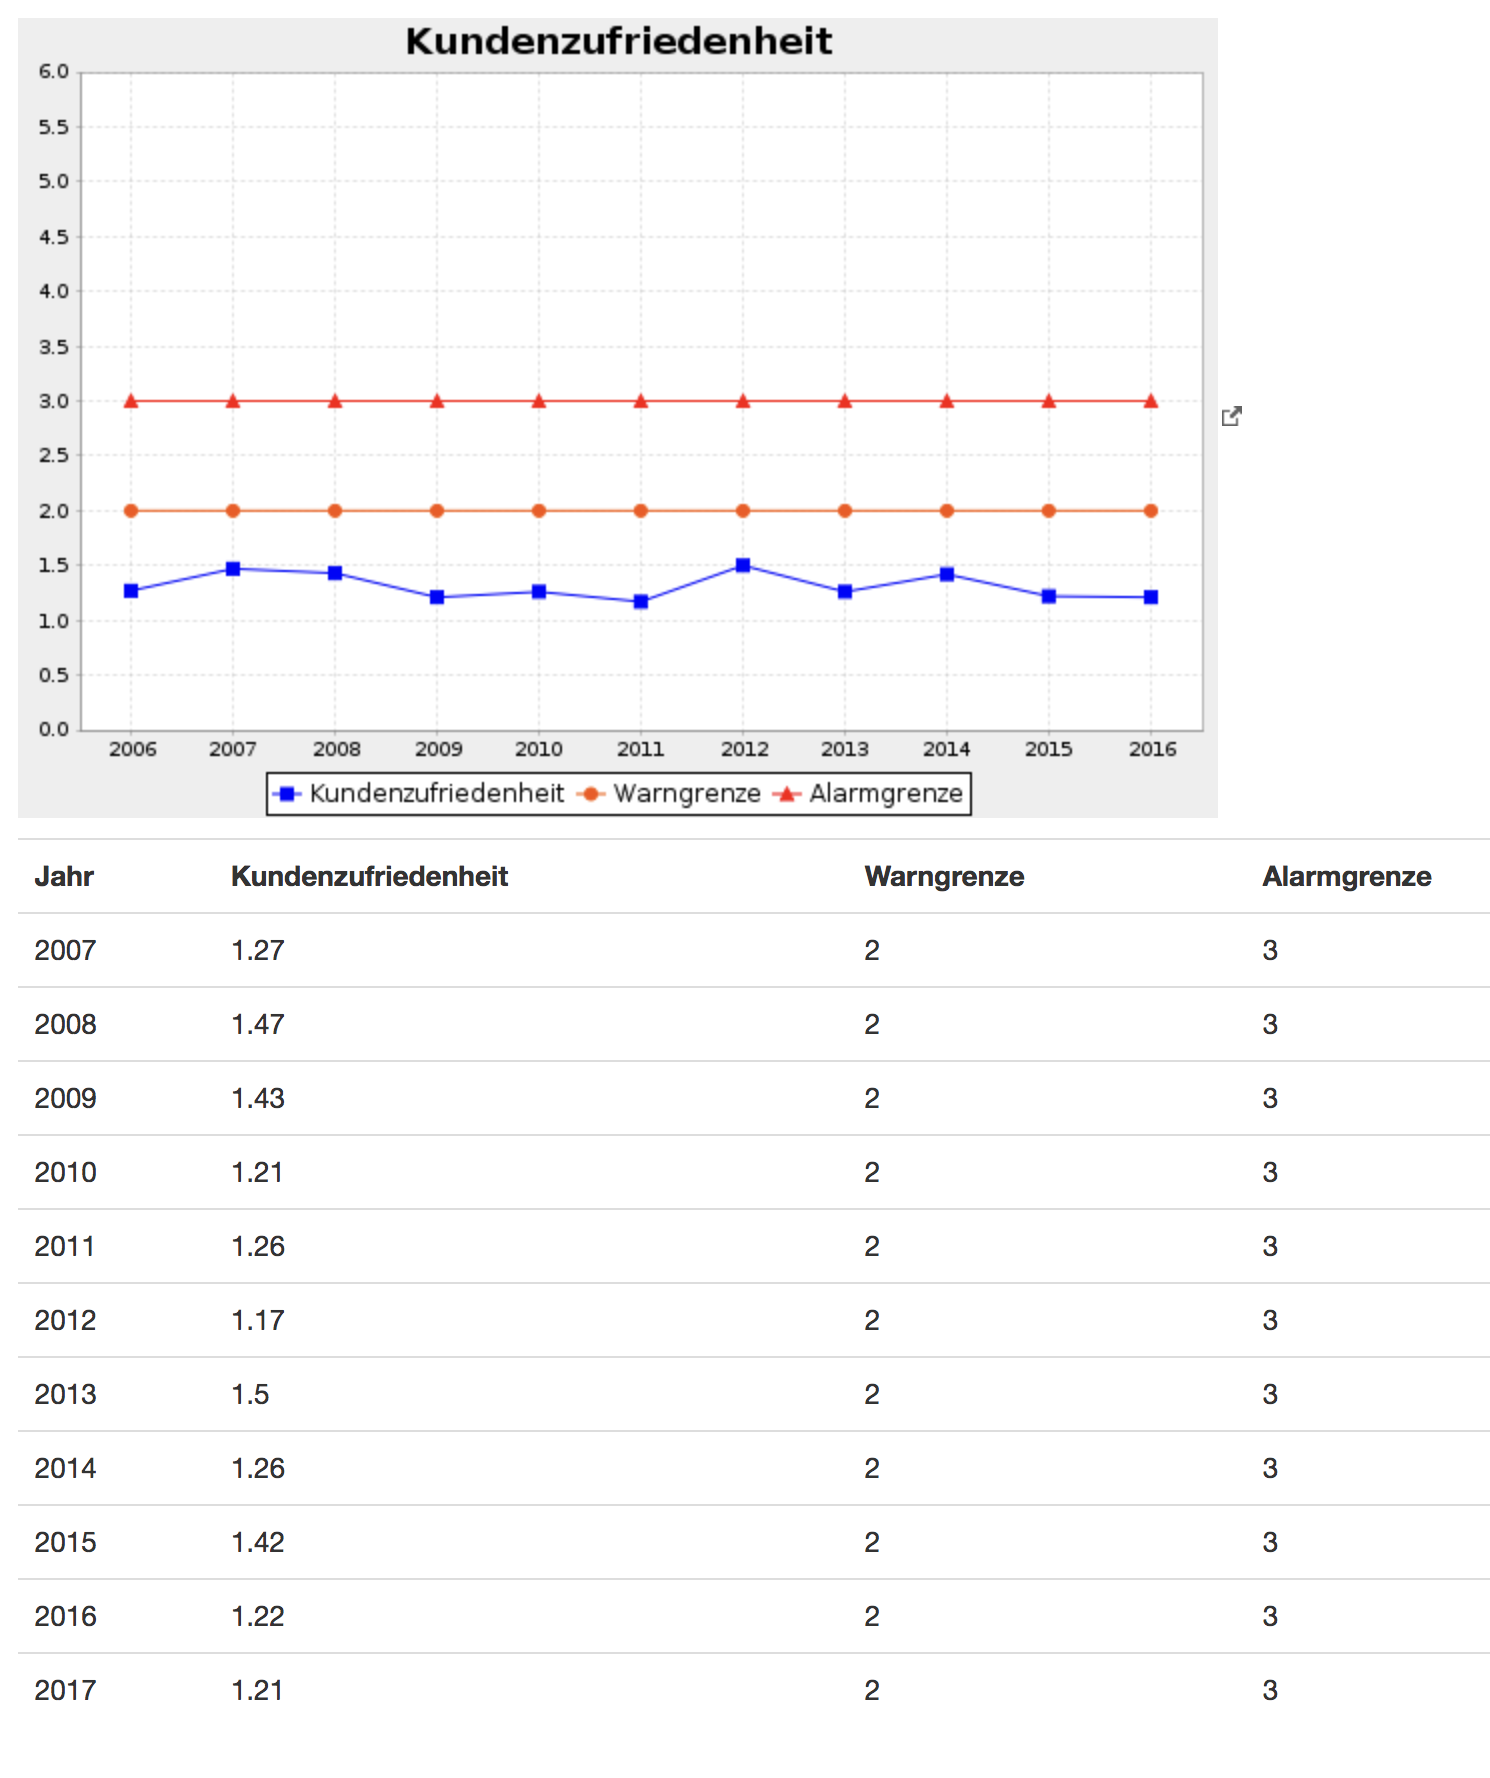
{{chart type="xy_line_and_shape" height="400" params="table:Kundenzufriedenheit;range:B2-D.;dataset:timetable_xy;domain_axis_type:date;domain_axis_date_format:yyyy;date_format:yyyy;time_period:year;range_axis_lower:0;range_axis_upper:6;series:columns;colors:0000FF,FA5000,FF0000" title="Kundenzufriedenheit" width="600"}}{{/chart}}

(% id="Kundenzufriedenheit" style="width:50%" %)
|=Jahr|=Kundenzufriedenheit|=Warngrenze|=Alarmgrenze
|2007|1.27|2|3
|2008|1.47|2|3
|2009|1.43|2|3
|2010|1.21|2|3
|2011|1.26|2|3
|2012|1.17|2|3
|2013|1.5 |2|3
|2014|1.26|2|3
|2015|1.42|2|3
|2016|1.22|2|3
|2017|1.21|2|3
FTR this is what it generates (a screenshot always is better than a text desc) 
Right!
Maybe related effect, where the year-axis looks strange: 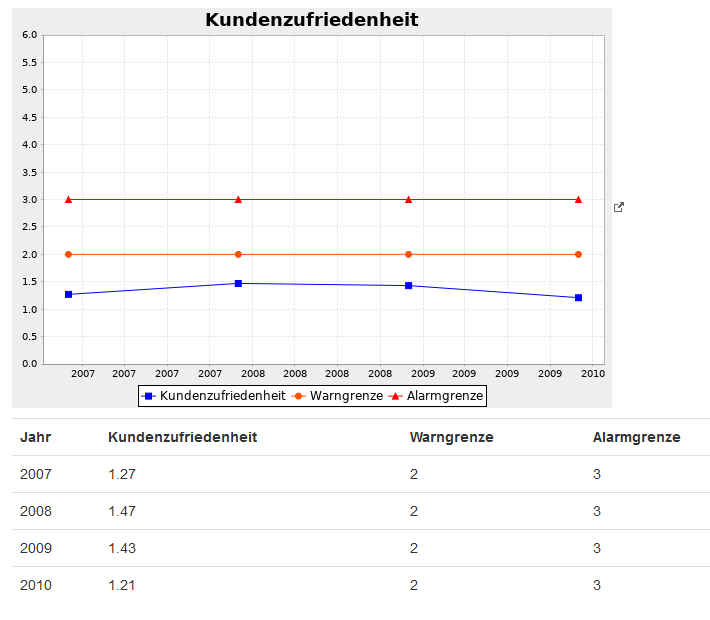
Hello community,
anybody any idea why this does not work (for me)?
Thanks Markus
@MarkusL I don’t know jfreechart enough but it looks like a bug to me so you could raise a jira issue at Loading...
You could also ask on the jfreechart forum/mailing list since I’m not sure XWiki does anything special on top of jfreechart for this use case.