I have a new installation of XWiki on a Raspberry Pi 4 machine which has 8GB RAM. The CPU usage of accessing a page, especially the admin Profile page is extremely high, giving 100% on all 4 CPU cores. It takes a few seconds before any page to render, and longer for the profile page. No error is logged during the page request.
My set up has the following notable items:
I use Nginx to server static content
I use the following JVM setting: JAVA_OPTS="-Djava.awt.headless=true -Xms512m -Xmx4096m -Dfile.encoding=utf-8 -XX:+UseShenandoahGC"
I use PostgreSQL, default setup as installed by the XWiki package
I am not a Java backend developer nor am I professional system admin. So I don’t really know what to look for.
While I decided to abandon XWiki after some serious evaluation and troubleshooting on XWiki’s Matrix channel, I guess I will leave some helpful insights for you.
No amount of GC tuning will save any amount of time, period. I tried every GC shipped with JVM and a wide range of parameters – and they all behave the same.
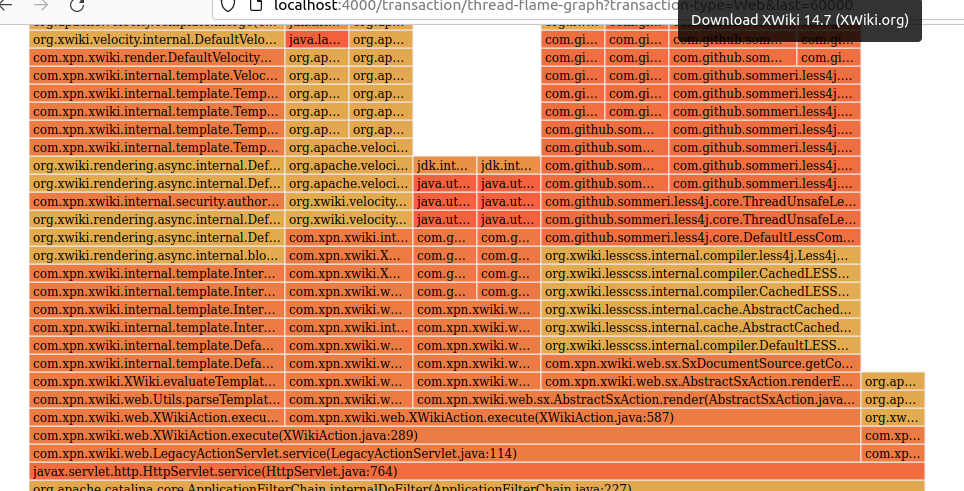
From JVM profiling, the culprit is Velocity (template rendering) and LESS (CSS generation)
XWiki is almost definitely CPU-bound
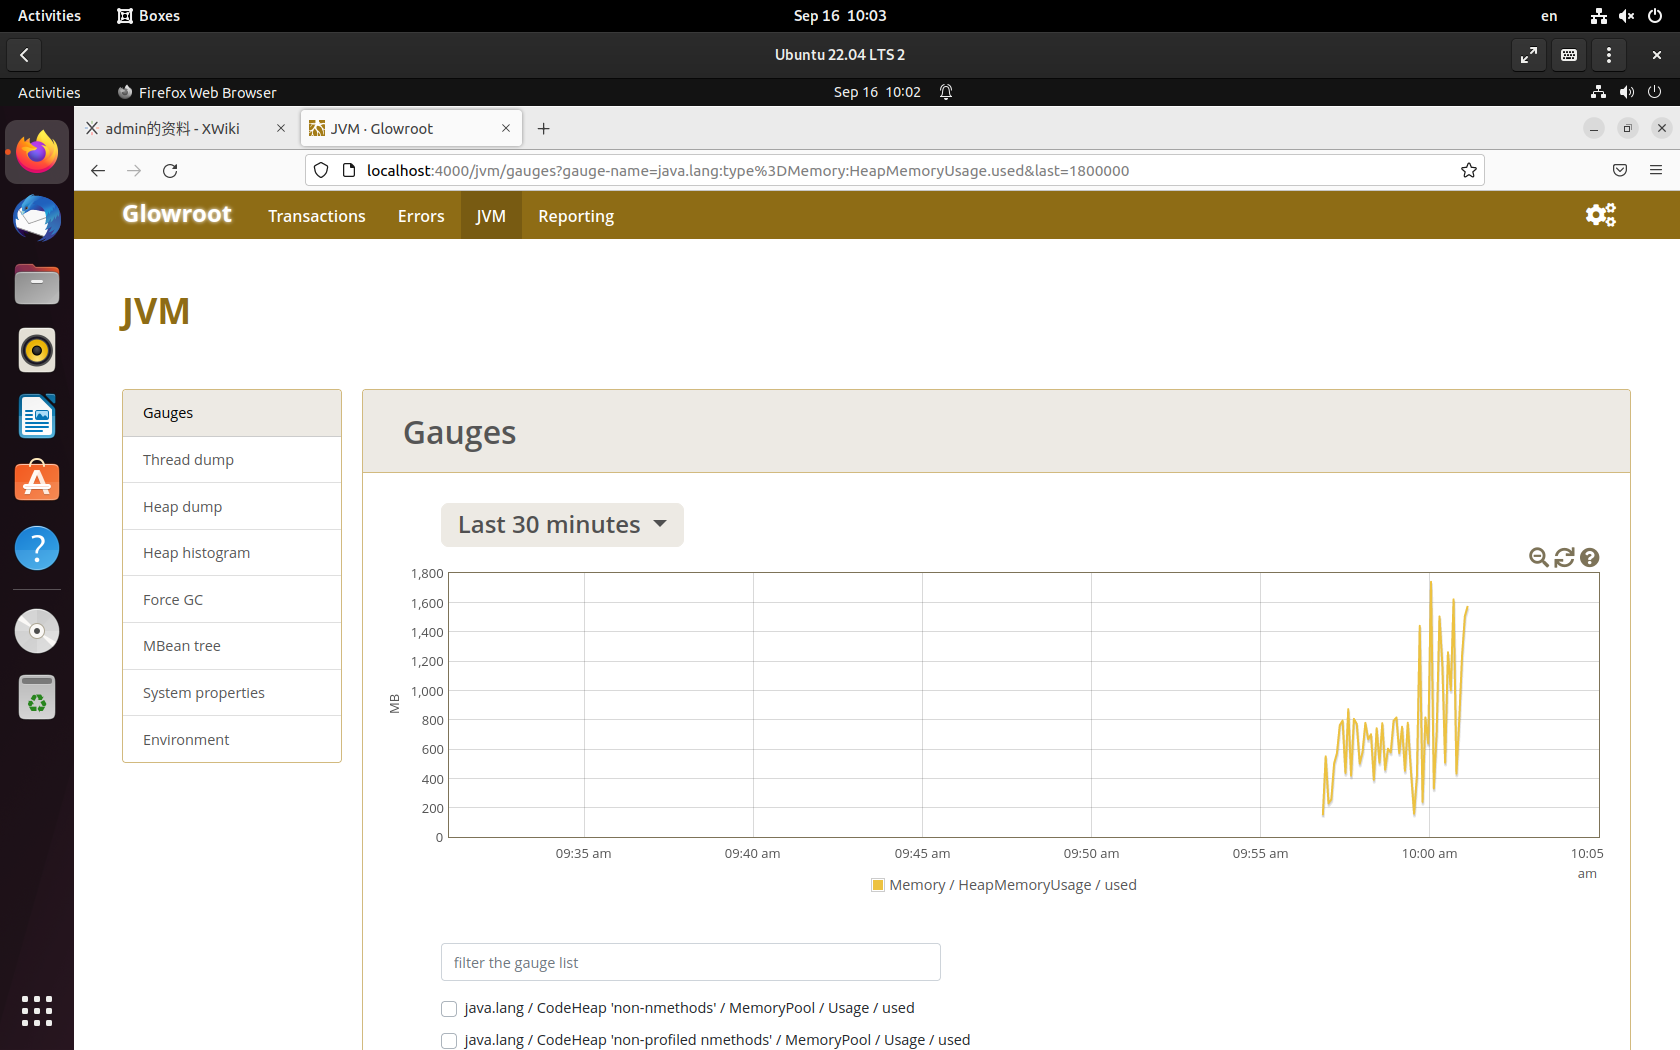
No matter how much I tune JVM settings, XWiki always spikes heap usage to use ALL CPU POWER AND ALL AVAILABLE HEAP SPACE, then goes down again. This is especially apparent in pages with lots of requests, like the profile page. This means the uncached load time can be as long as 10s on an idle server.
In addition, XWiki does not scale at all. Changing the number of CPU cores and heap space does not reduce response time, nor does it increase the number of concurrent process. With my set up, I can only get 10 connections max before the response time raises beyond 1 minute. Not on a Raspberry Pi, on a real server with i7 processors and plentiful memory. I am talking about 12 cores and 8GB of RAM, way beyond what the recommended spec says.
I can assume that if you go for a blank wiki and ditch all the Velocity and LESS stuff the response time would be far, far better. But still note that these two parts take up only about 75% of the response time.
In short, XWiki makes the decision simple: if you don’t absolutely need a certain functionality which only XWiki provides, don’t use it. No server on Earth can make it fast.
Thank you @rongcuid, that is all very inresting information.
If your statements cannot be refuted by the developers or senior users, then I think I will move away from Xwiki too.
I aim to find a solution that interconnects communities on global level using a interwiki-like structure for collaboration and exchange of knowledge. It will need to be robust to support many thousands of users and millions of pages. Needless to say this cannot be a commercial solution. It will be for a non-profit social movement.
Apart from the CPU issue, I wonder if Xwiki is suitable for my usecase, since it needs to be very scalable.
The last few days I did research on the CPU issue in the xwiki.org site and googled on similar situations. Unti now I did not have success with the solutions that were suggested.
I’m interested in the response of the develpers and other users.
This is clearly not correct. There are thousands of XWiki installations over the world which are very performant and very scalable (with millions of wiki pages and tens of thousands and more users).
It’s nice to see there are thousands of performant installations, but they are not going to make my installation fast.
Now, please forgive my stern words.
I have evaluated XWiki ever since version 11 or so, once per major version. Every time I was in hopes that “this version might finally be faster”, but no. XWiki never got fast, now that it is version 14.
I don’t know whether you have data to back your claim about “performant” and “scalable”, but I can definitely show you data proving the opposite, where an uncached page load taking >30s and 10 concurrent accesses requiring >2min, where a single page load takes 8GB RAM and 100% all-cores on a 12-core i7 VM.
With all that info, the most helpful message I get from the community is “get a more powerful server” and “this should not happen” but nobody can help investigate.
Unless you tell me for certain that 10s page load on Profile page is normal and expected, that taking up all CPU power to render the simplest of a Getting Started page is normal, that taking up 8GB heap space on every page load is normal, I would not trust a claim saying XWiki is performant and scalable.
Hopefully my definition of “scalable” is not different from XWiki’s. XWiki might handle a million pages and ten thousand users, but if only 5 users can use it and open 2 tabs each simultaneously, it is not scalable, in my definition.
If you are interested, I will give some rough profiling info.
Glowroot flamegraph of one uncached Profile page load:
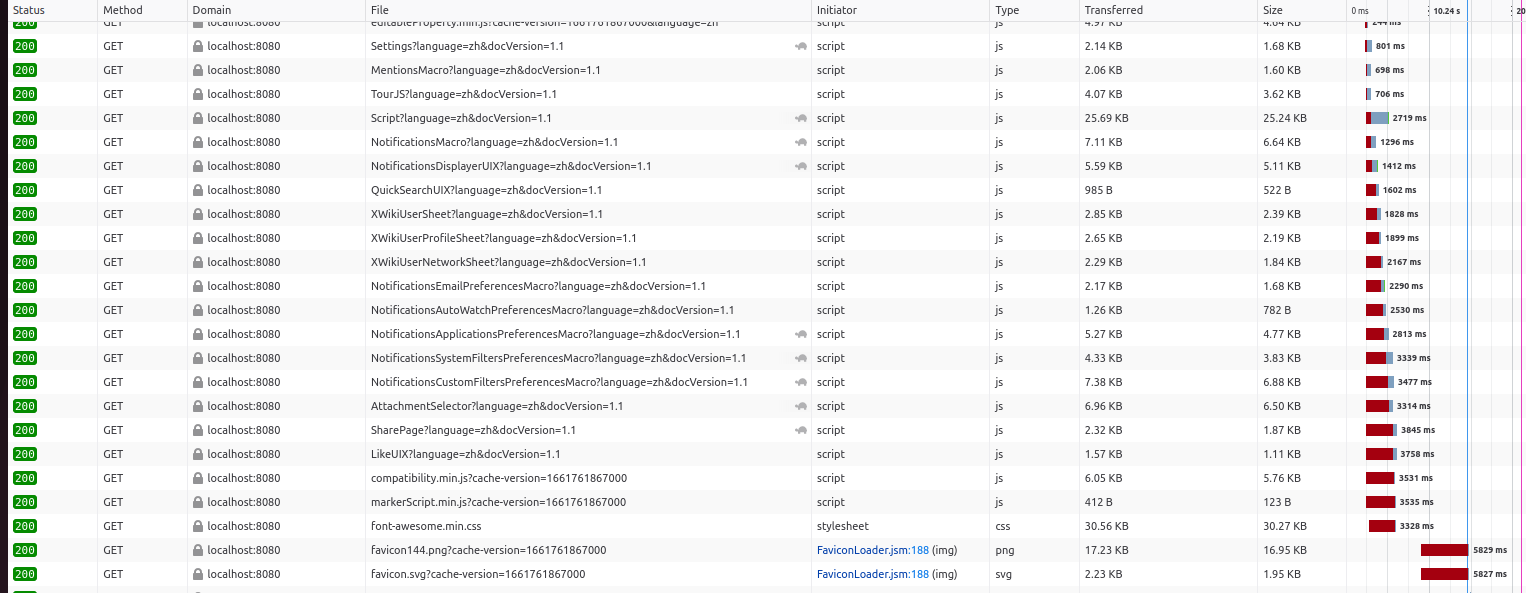
Firefox trace of an absolutely ridiculously long page load:
Some very rough JVM memory profiling, each spike to the top is a page load:
Take these with a tablespoon of salt. XWiki is being deployed in a VM, not a bare-metal server. I am not a Java developer, a backend engineer, or a sys admin.
All the same time, all CPU would be full. I don’ have a good screenshot or log for that. If a developer wants to investigate the problem, I am happy to spin up the VM again and help.
@rongcuid thank you for the extra details of your issues. @vmassol thank you for your response.
Firstly it is always important for users to realize that open source software is based on people’s willingness to donate time and effort, so I just wanted to start off with thanking the xwiki.orgs developers team for this application. I also know that constructive feedback is valuable for an application to evolve, so regardless whether I am using it in the future or not, last week I did my best to troubleshoot my installation issues. The current topic is the 100% CPU that according to other users, can happen.
I have reinstalled xwiki about 20 times in the last week, in order to weed out any misconfigurations that I had. Yesterday I did all steps again, including reverse proxy and https for nginx and tomcat, as well as creating subwiki’s with subdomains. Until now, this went Okay, and the CPU is around 2% when no pages are accessed. Of course I don’t take into account the CPU spikes when booting up and installing subwikis etc.
So the 100% CPU is clearly a misconfiguration, or it results from extensions that I did not yet try out yet this time. So there is hope, but I did not find the culpit yet.
Overall, the page load speed is between 1.5 and 7 seconds, depending on whether the page is accessed for the first time and if it has a lot of content and objects. In general page loads are between 2 and 2.5 seconds. This can be considered slow for the current web standards, and seen the current processor and memory availability, I don’t think this will improve much.
I think that an acceptible page load time is max 1 second, otherwise users (including me) build a tension and eventually abandon the application. I did not dive into performance optimization of xwiki yet, and otherwise post about it in another thread.
I’m not an advanced Java programmer, but I think that’s a dead end: the GC contends time / CPU with the regular threads, so if you want an absolute speed up from the GC, the GC should be turned off - of course your run time will end as soon as there’s no memory left.
I am using Java 11. The reason I use Shenandoah is so that JVM releases RAM back to OS when not using the memory. Java 11’s G1 and Parallel GC don’t release heap back to OS.
Postgres process takes only tiny amount of CPU. The driver does not even show in flamegraph. So I don’t think PG is the issue here.
When I’ve managed to keep our XWiki system at full cpu capacity due to mostly self-inflicted problems with my macros, a look at the Tomcat status page has helped me see which requests are currently consuming any cpu time.