Hello.
I have an XWiki 16.7.1 under Apache Tomcat 9.0.95 on a Debian based VM on GCP. Running with Java openjdk 17.0.13 2024-10-15
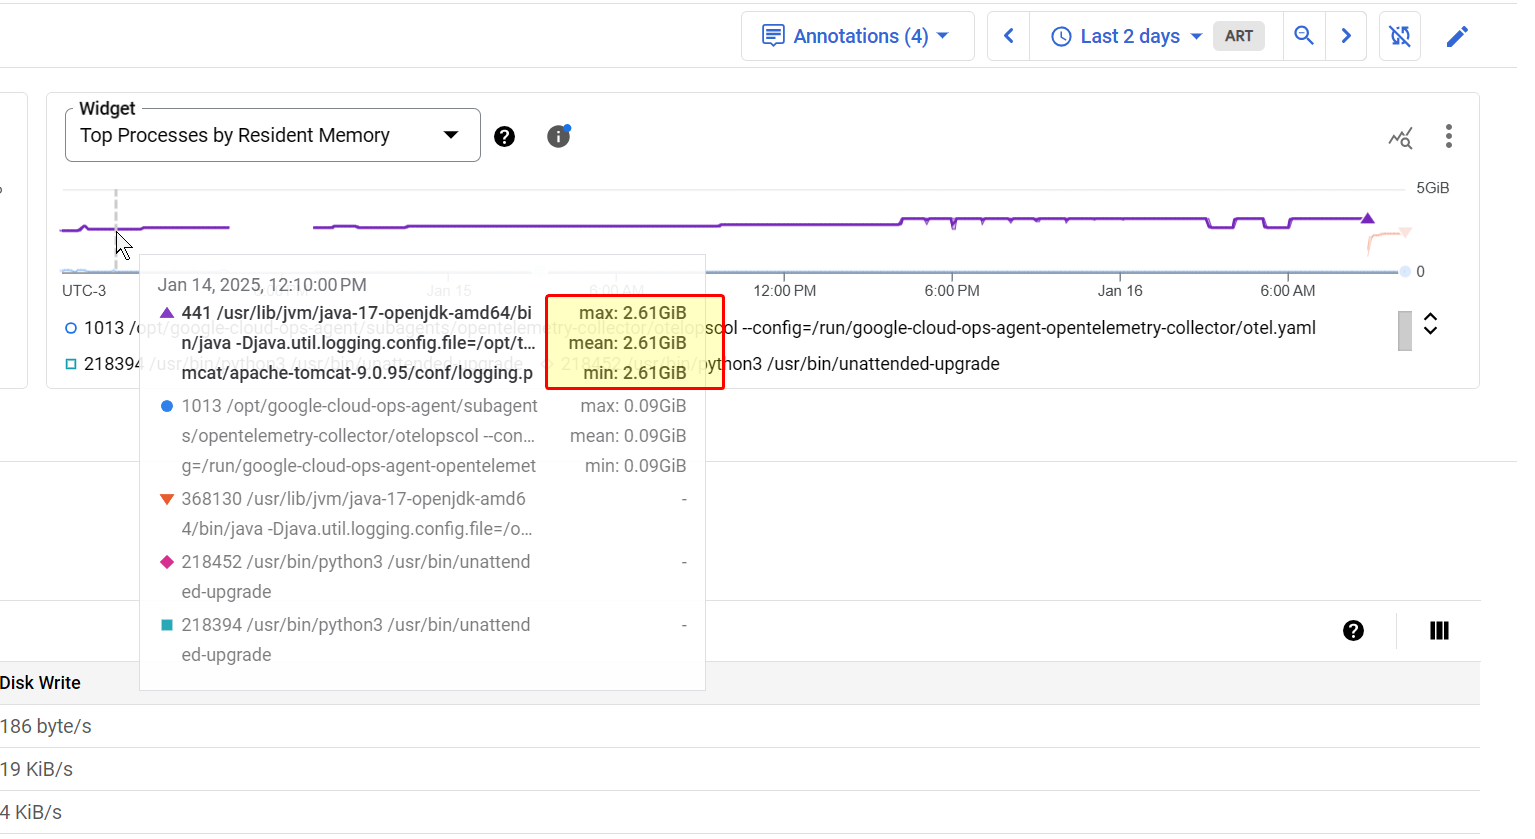
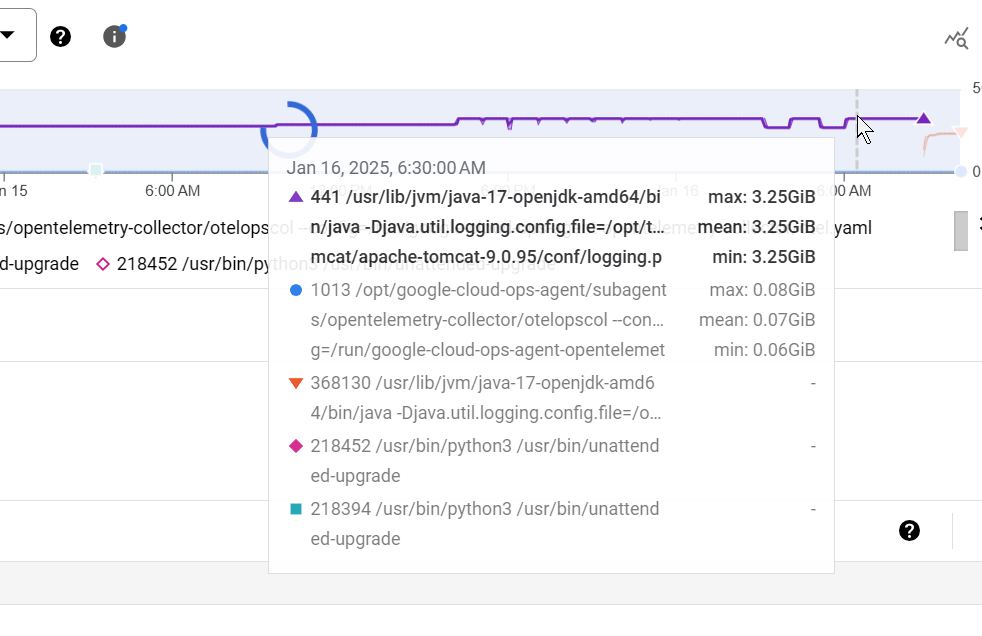
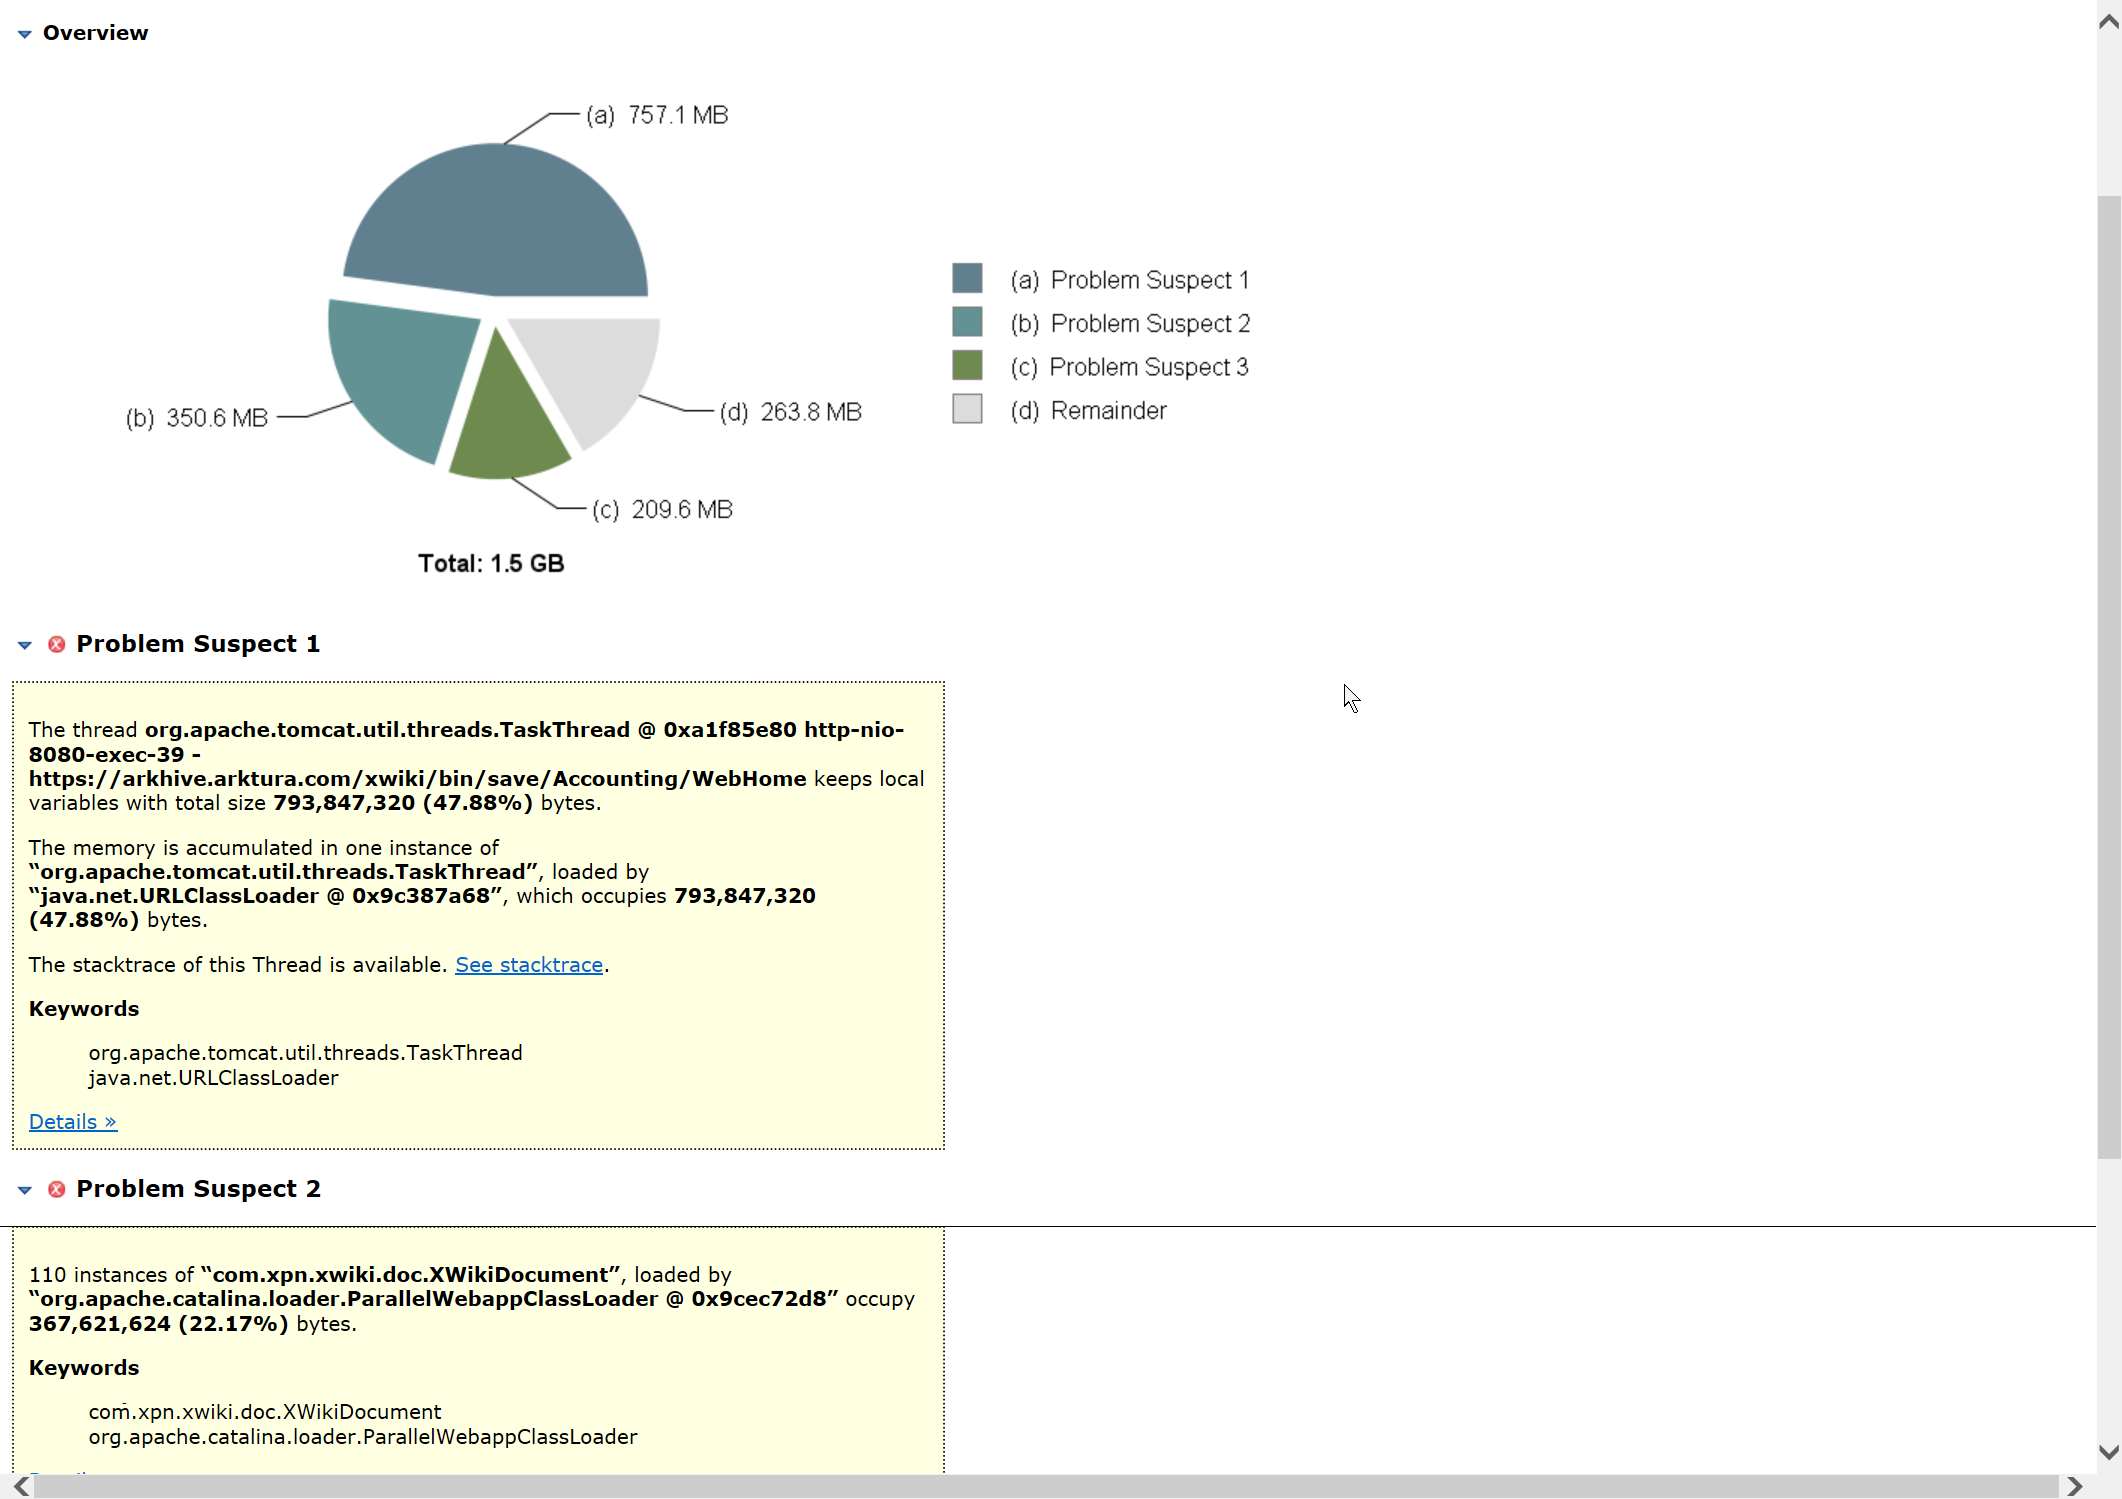
Yesterday the XWiki instance crashed and I would like to know how can I start troubleshooting the ‘cause’ of the crash. And/or if I need to enable something on the instance to be able to catch the cause of the crash next time.

This is what we saw on the page, seemingly Apache Tomcat was unable to find the internal website of XWiki, correct?
Thank you very much for any help.
Here’s the Catalina last log from yesterday with a SEVERE indicator:
15-Jan-2025 19:47:41.439 SEVERE [Catalina-utility-1] org.apache.catalina.core.ContainerBase.threadStart Exception processing background thread
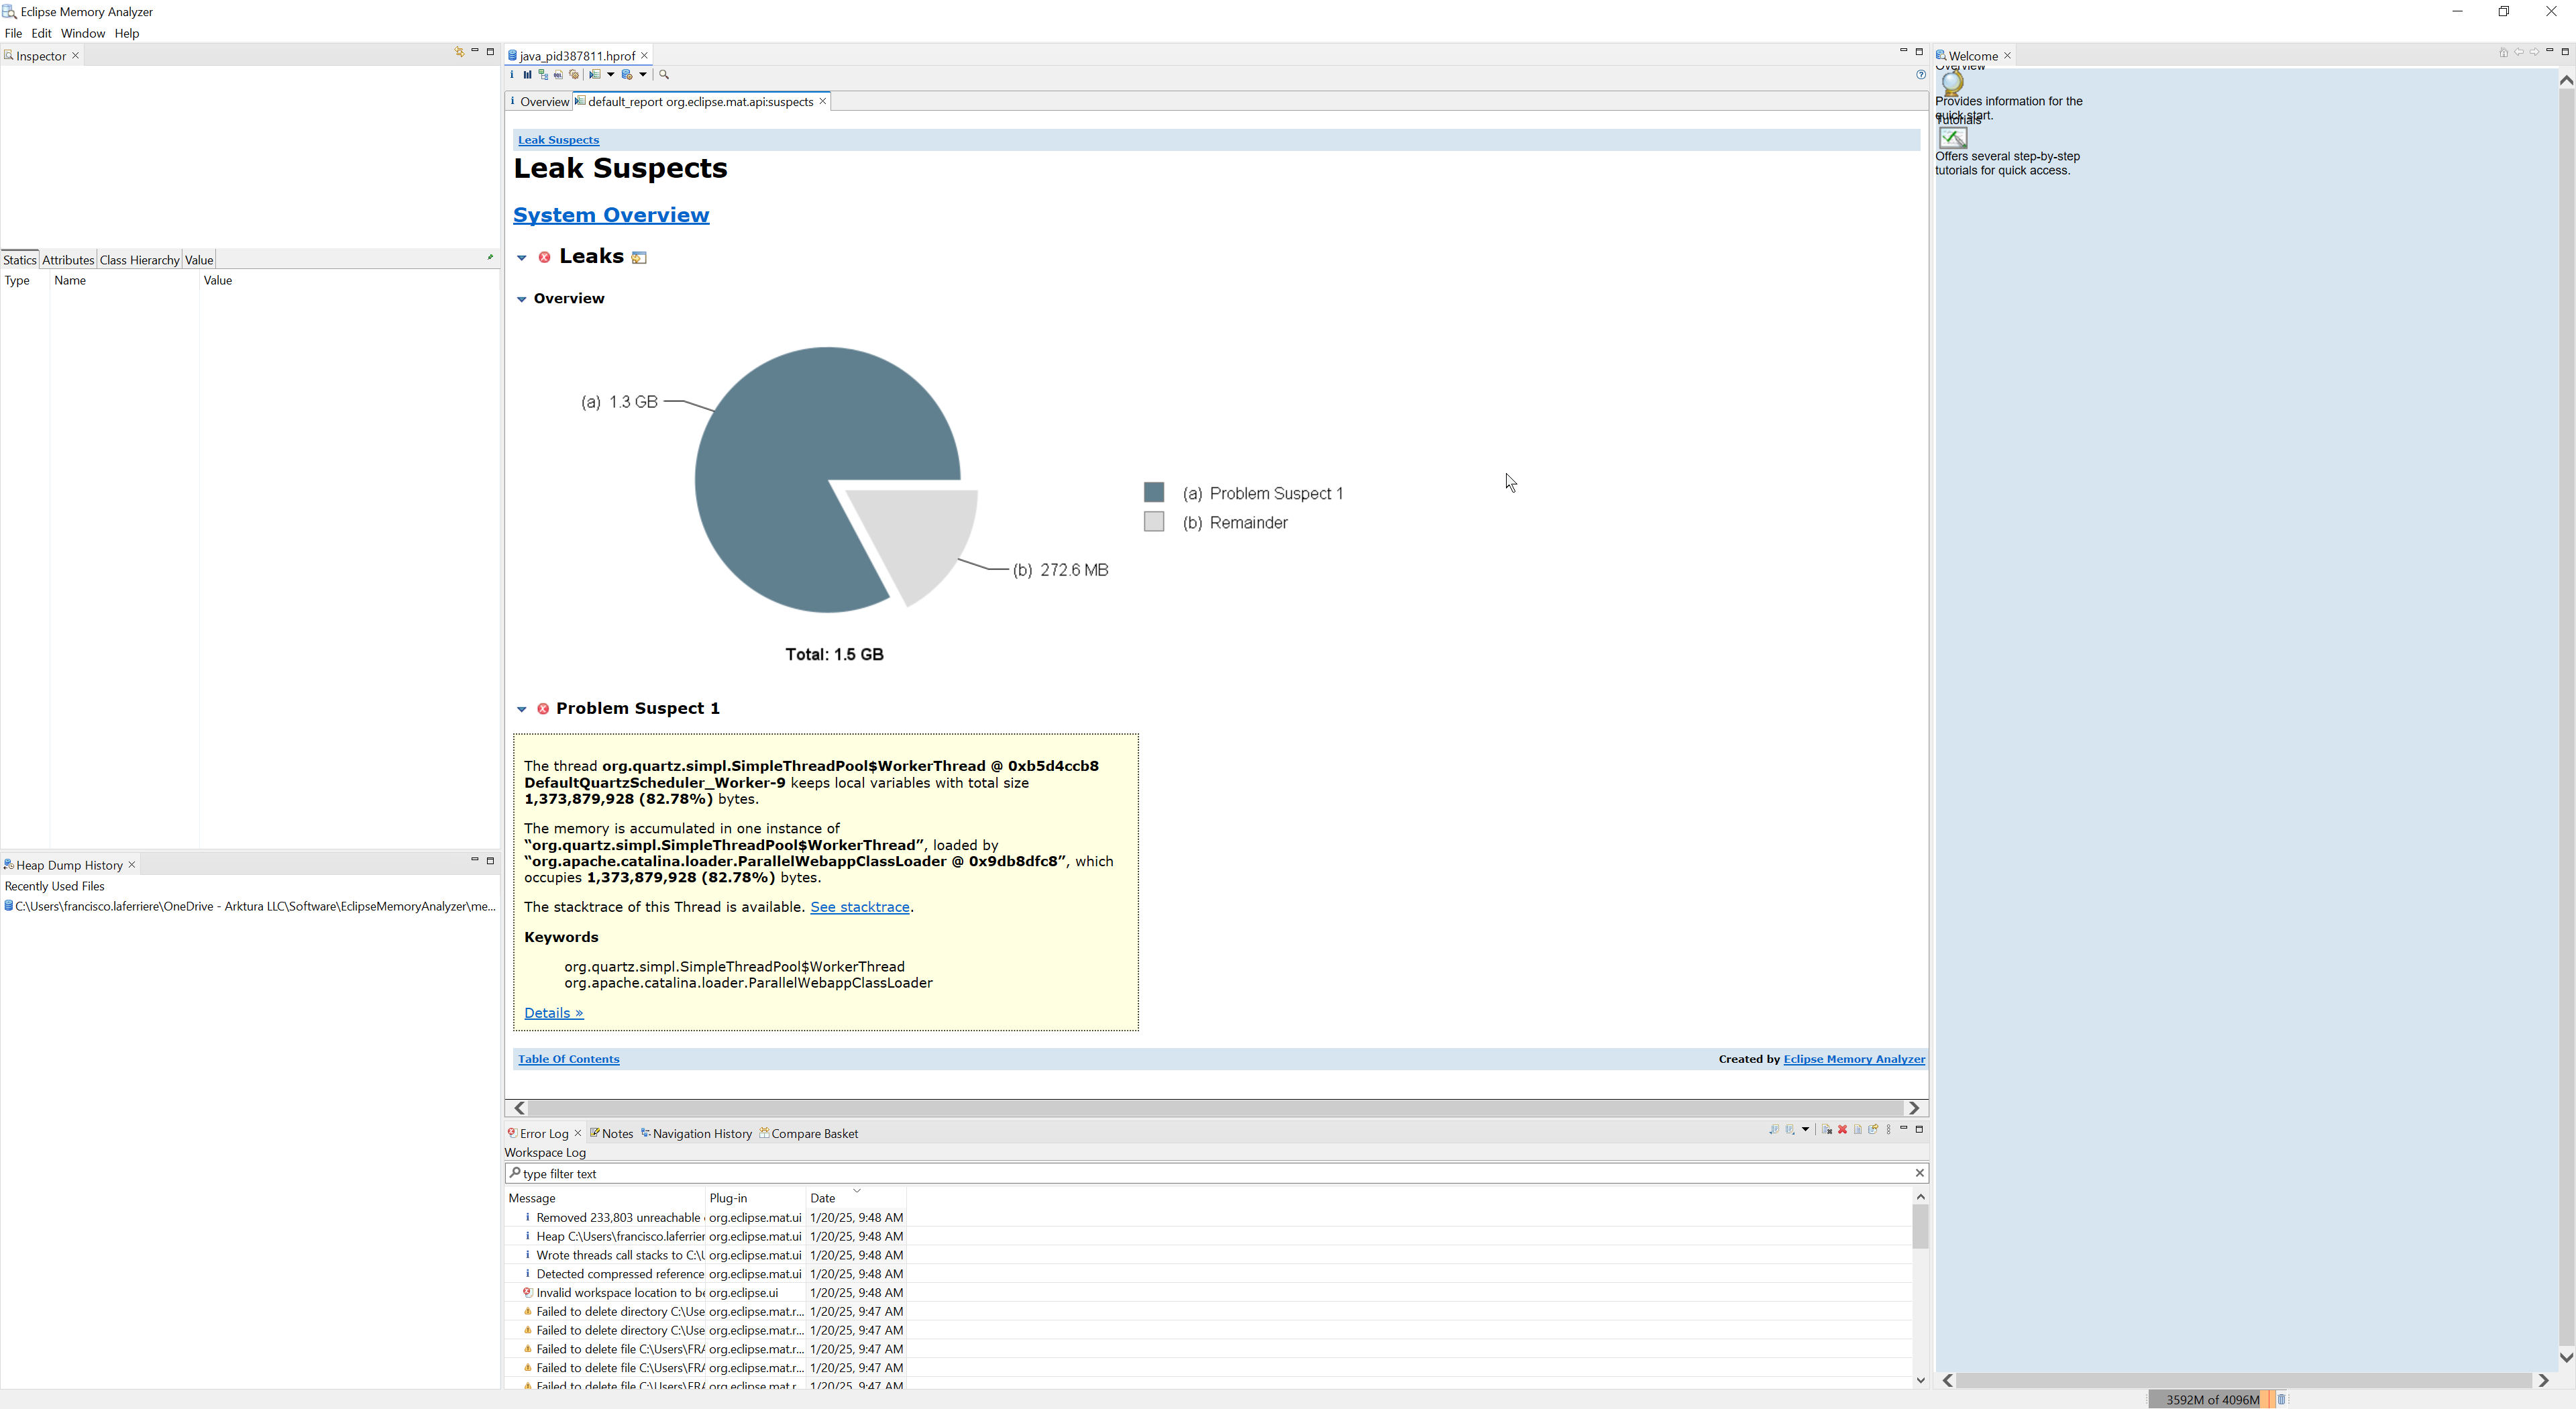
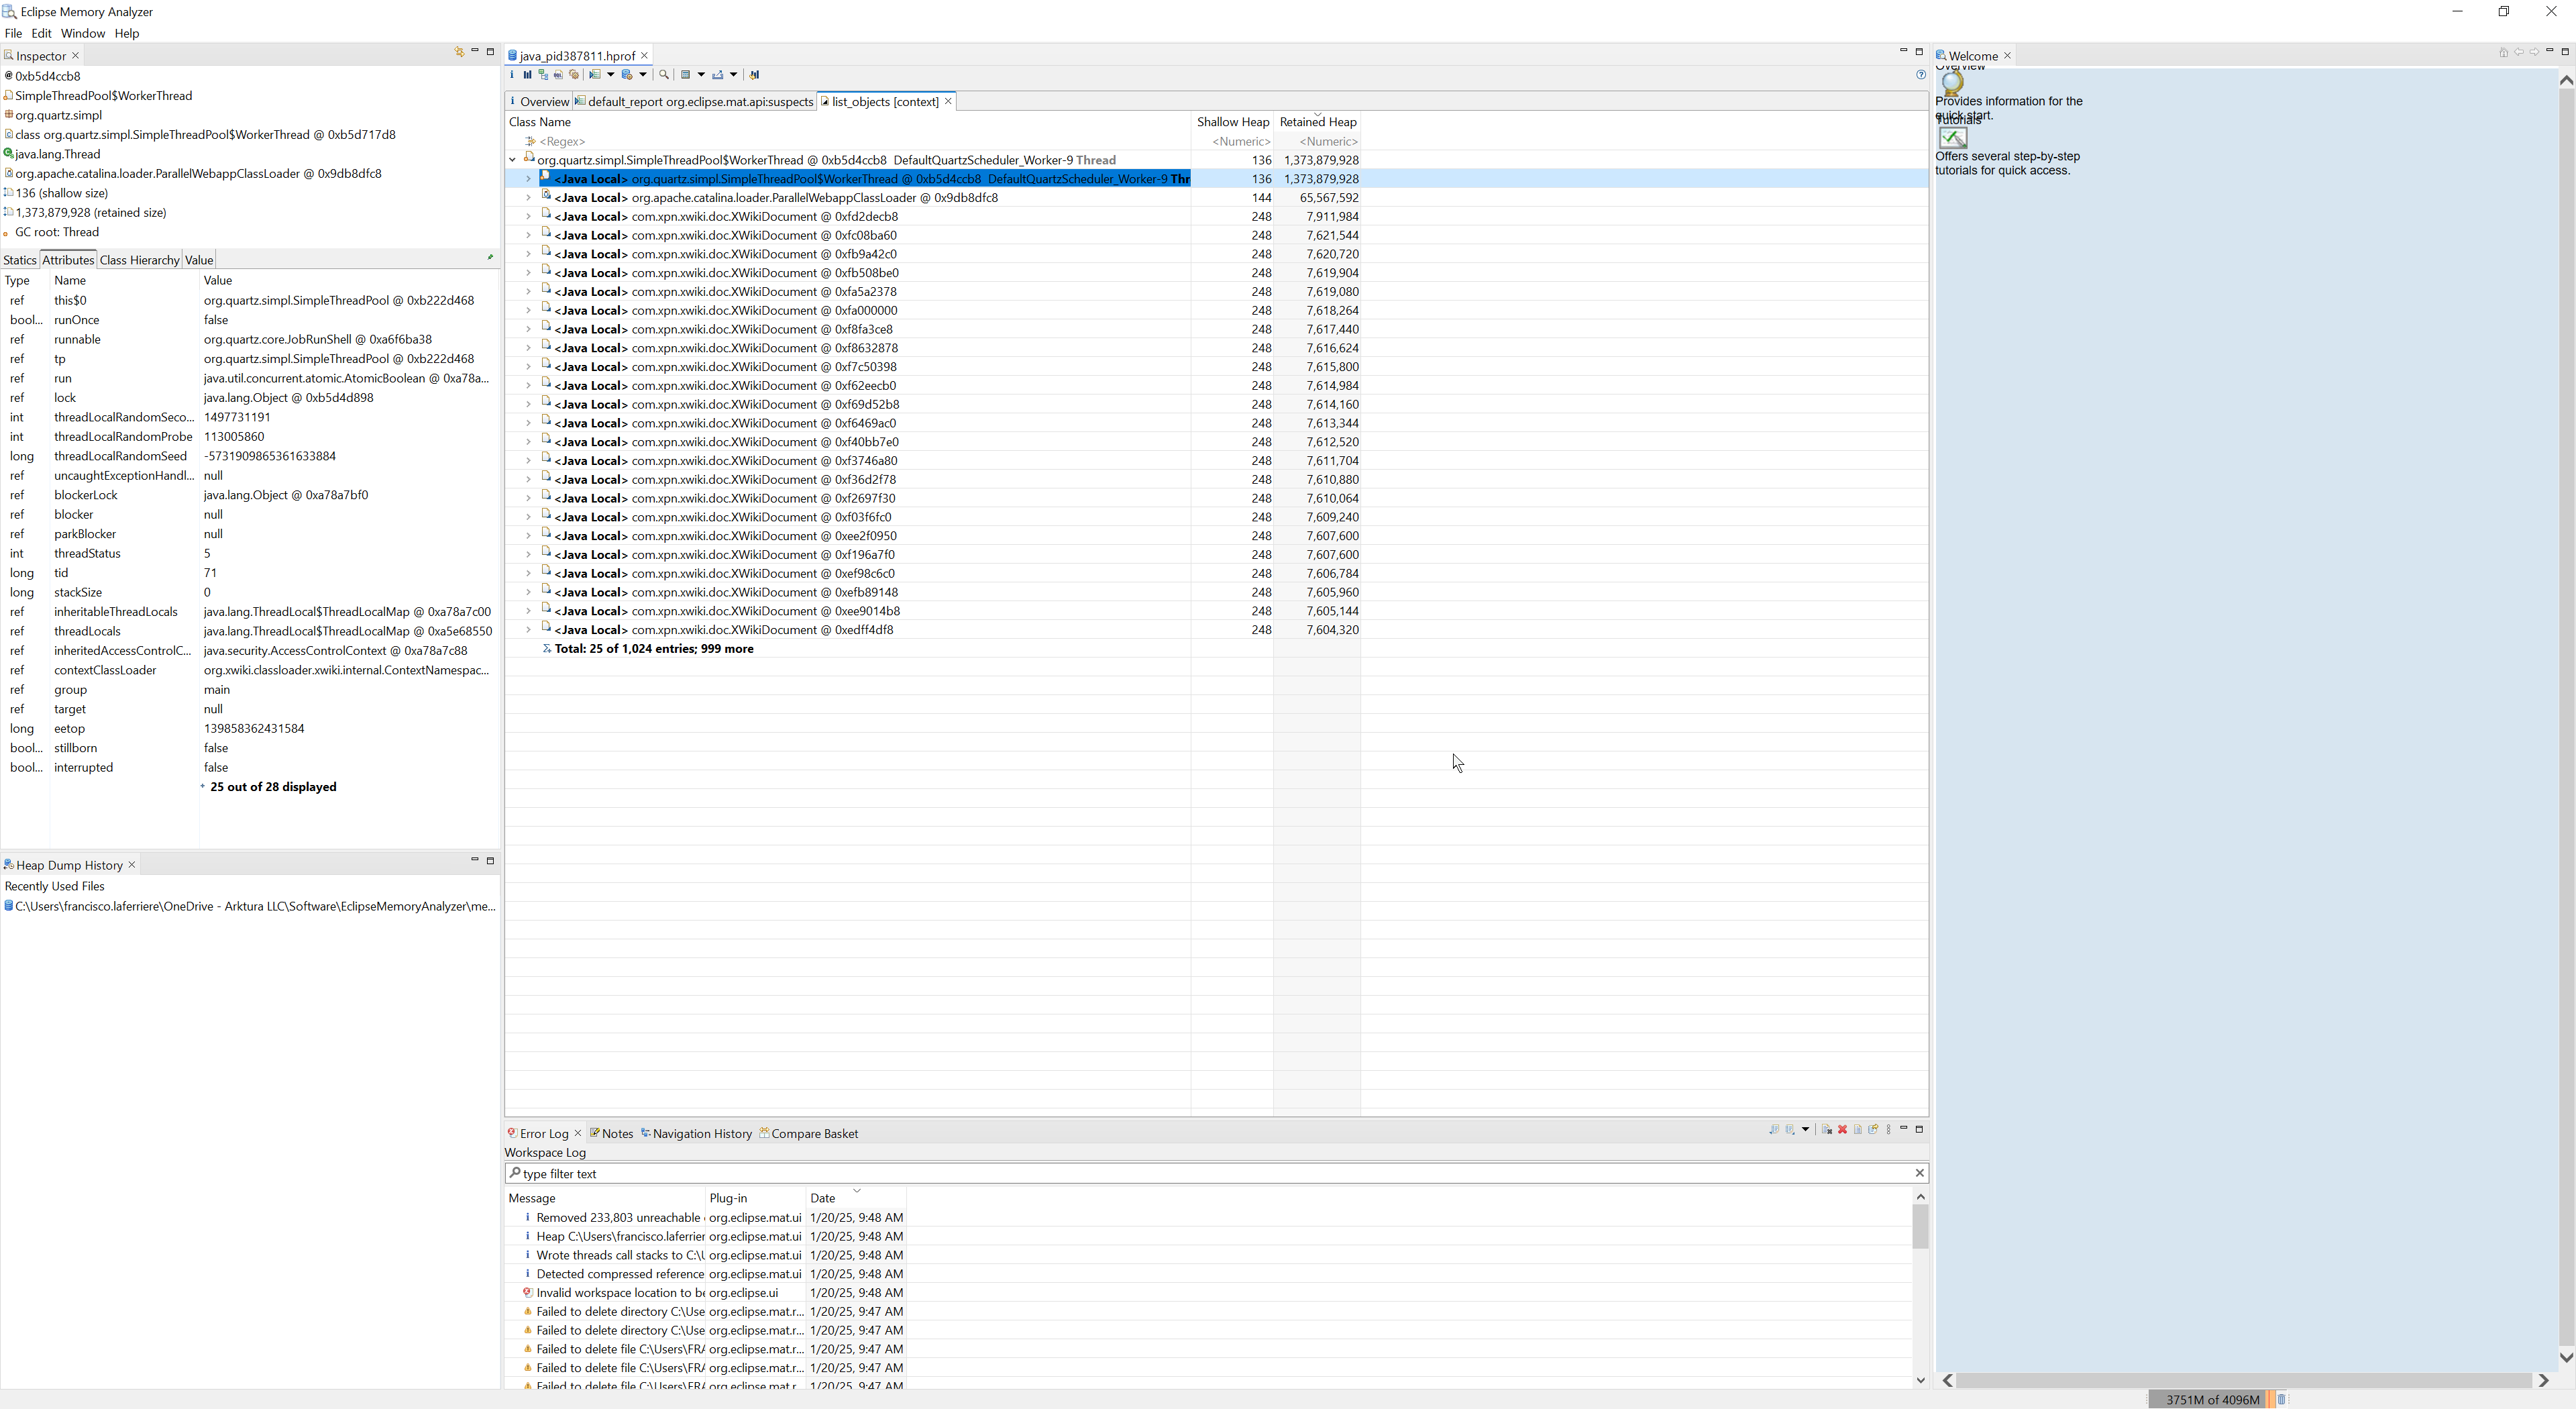
java.util.concurrent.ExecutionException: java.lang.OutOfMemoryError: Java heap space
at java.base/java.util.concurrent.FutureTask.report(FutureTask.java:122)
at java.base/java.util.concurrent.FutureTask.get(FutureTask.java:191)
at org.apache.catalina.core.ContainerBase.threadStart(ContainerBase.java:1097)
at org.apache.catalina.core.ContainerBase$ContainerBackgroundProcessorMonitor.run(ContainerBase.java:1141)
at java.base/java.util.concurrent.Executors$RunnableAdapter.call(Executors.java:539)
at java.base/java.util.concurrent.FutureTask.runAndReset(FutureTask.java:305)
at java.base/java.util.concurrent.ScheduledThreadPoolExecutor$ScheduledFutureTask.run(ScheduledThreadPoolExecutor.java:305)
at java.base/java.util.concurrent.ThreadPoolExecutor.runWorker(ThreadPoolExecutor.java:1136)
at java.base/java.util.concurrent.ThreadPoolExecutor$Worker.run(ThreadPoolExecutor.java:635)
at org.apache.tomcat.util.threads.TaskThread$WrappingRunnable.run(TaskThread.java:63)
at java.base/java.lang.Thread.run(Thread.java:840)
Caused by: java.lang.OutOfMemoryError: Java heap space
at java.base/java.util.TreeMap.addEntry(TreeMap.java:765)
at java.base/java.util.TreeMap.put(TreeMap.java:828)
at java.base/java.util.TreeMap.put(TreeMap.java:534)
at java.base/java.util.TreeSet.add(TreeSet.java:255)
at java.base/java.util.AbstractCollection.addAll(AbstractCollection.java:336)
at java.base/java.util.TreeSet.addAll(TreeSet.java:309)
at org.apache.catalina.webresources.Cache.backgroundProcess(Cache.java:212)
at org.apache.catalina.webresources.StandardRoot.backgroundProcess(StandardRoot.java:608)
at org.apache.catalina.core.StandardContext.backgroundProcess(StandardContext.java:4817)
at org.apache.catalina.core.ContainerBase$ContainerBackgroundProcessor.processChildren(ContainerBase.java:1172)
at org.apache.catalina.core.ContainerBase$ContainerBackgroundProcessor.processChildren(ContainerBase.java:1176)
at org.apache.catalina.core.ContainerBase$ContainerBackgroundProcessor.processChildren(ContainerBase.java:1176)
at org.apache.catalina.core.ContainerBase$ContainerBackgroundProcessor.run(ContainerBase.java:1154)
... 7 more
15-Jan-2025 19:50:11.639 SEVERE [Catalina-utility-3] org.apache.catalina.core.ContainerBase.threadStart Exception processing background thread
java.util.concurrent.ExecutionException: java.lang.OutOfMemoryError: Java heap space
at java.base/java.util.concurrent.FutureTask.report(FutureTask.java:122)
at java.base/java.util.concurrent.FutureTask.get(FutureTask.java:191)
at org.apache.catalina.core.ContainerBase.threadStart(ContainerBase.java:1097)
at org.apache.catalina.core.ContainerBase$ContainerBackgroundProcessorMonitor.run(ContainerBase.java:1141)
at java.base/java.util.concurrent.Executors$RunnableAdapter.call(Executors.java:539)
at java.base/java.util.concurrent.FutureTask.runAndReset(FutureTask.java:305)
at java.base/java.util.concurrent.ScheduledThreadPoolExecutor$ScheduledFutureTask.run(ScheduledThreadPoolExecutor.java:305)
at java.base/java.util.concurrent.ThreadPoolExecutor.runWorker(ThreadPoolExecutor.java:1136)
at java.base/java.util.concurrent.ThreadPoolExecutor$Worker.run(ThreadPoolExecutor.java:635)
at org.apache.tomcat.util.threads.TaskThread$WrappingRunnable.run(TaskThread.java:63)
at java.base/java.lang.Thread.run(Thread.java:840)
Caused by: java.lang.OutOfMemoryError: Java heap space